Adding tracing to ghcide
Posted on May 22, 2020 by Michalis Pardalos

Welcome to the third post on the ongoing work on a unified Haskell IDE. This week I will be talking about my Google Summer of Code project to introduce tracing into ghcide using OpenTelemetry. I will explain the motivation for this project and then explain what it actually entails, as well as what improvements you should expect to see as a result of it.
What is the problem?
The internal architecture of ghcide is based on the Shake build system. This is a tool similar in principle to UNIX make, except implemented as a Haskell library. While using a build tool as the core of an IDE might be surprising, it simplifies the internals of the engine, and allows for reuse of information. This is a big contributor to ghcide’s speed. A more detailed explanation is given here.
It’s not all rosy though. In order for shake to provide these benefits, it must entirely (with some caveats) control the execution of the IDE engine. Shake loads/parses/typechecks files whenever it sees fit, based on which files have changed and what is requested by the editor. This means that reasoning about performance becomes much harder. It’s hard to tell what action is slow when you don’t know or directly control which ones are running.
So what are you doing about it?
Addressing this problem is the core of my Google Summer of Code project: I will be introducing tracing to ghcide. This essentially amounts to wrapping interesting sections of code in print "begin <section>" and print "end <section>", albeit in a slightly more sophisticated way. This will allow us to track which sections are running at any given time and for how long. I will be doing this using opentelemetry and Dmitry Ivanov’s (@ethercrow) haskell-opentelemetry library, allowing for better tooling support over simple console logging.
OpenTelemetry is a set of tools and APIs for monitoring applications in a variety of ways. We will be using its tracing portion which will allow us to view traces from ghcide in any opentelemetry-compatible viewer, like Jaeger or Google Chrome’s about:tracing. So, to address some confusion from the reddit comments on last week’s post: This has nothing to do with telemetry, as used in e.g. Visual Studio Code or Windows. It is explicitly opt-in and does not transmit any data over the network.
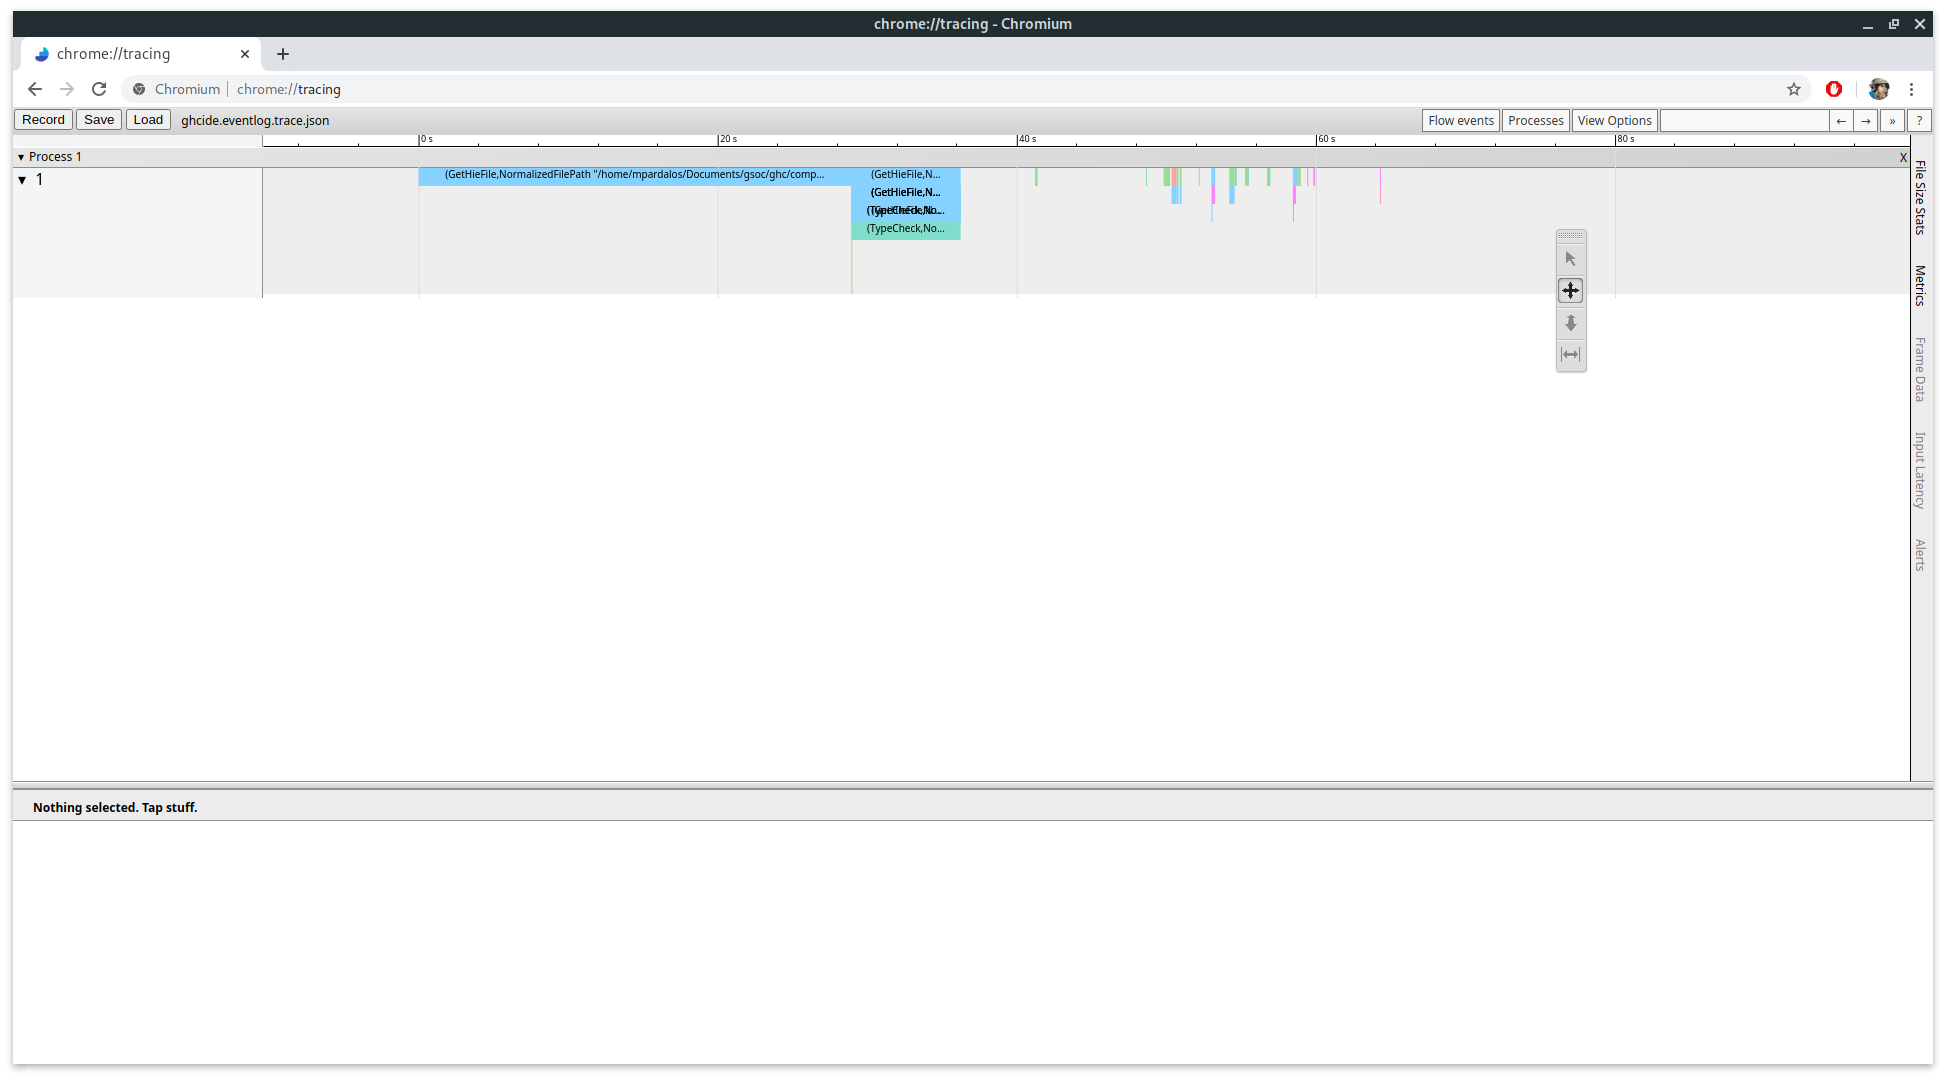
Matthew Pickering (@mpickering) has already started this effort. He has added initial support for tracing allowing us to get some basic traces. You can see an example of what is possible below:
This is a trace of ghcide running on GHC. Each bar represents a Shake Action, which is described by the text on the bar. For example the first bar represents loading the first file when the editor was started. You can see that we get no detail beyond how long the entire action took. We can’t tell if certain dependent modules took more or less time, or if the loading was properly parallelised.
The way shake works is that you issue Actions to be run, which can then request data, which based on rules is computed using other Actions, etc. We can currently only trace the initial actions, not any of their dependencies. For example, we know can see how long going to definition takes in its entirety, but not how much of that time was spent loading or parsing files. Adding this will give us a complete picture of what ghcide is doing, and is what I will be adding to ghcide’s tracing.
That’s great and all, but what do I get?
Great question! Indeed, this is a developer-facing feature. We are not expecting users of ghcide to be looking at traces. We are hoping however it will guide us towards a faster ghcide by showing us what parts are worth improving. It should also make locating certain classes of bugs easier by showing us if Shake is doing what we are expecting it to.
Other Updates
As always, we have all been working on other projects as well this week.
- Luke Lau has been implementing support for adding haddock documentation to functions using template-haskell to resolve a long standing GHC ticket.
- Fendor submitted his first GHC patch getting up to speed for the summer’s project.
- Matthew Pickering has been finishing off the multi component patch with the careful review of Moritz and Pepe. It looks like it will be merged within the next week.
- Avi Dessauer released the first version of implicit-hie which attempts to generate hie.yaml files for you.
- Zubin Duggal has continued working on integrating hie files into his fork of ghcide. You can read more about this in Zubin’s blog post next week.
Index